(Photo Credit: Biff Martin/Wikimedia)
Originally published in the Intersections newsletter of the California State Treasurer's office and republished with permission.
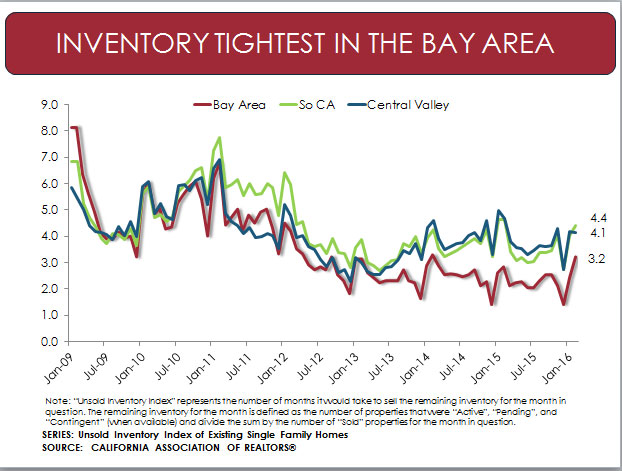
For years, when asked what is “normal” for unsold inventory of existing single family homes, I would refer to the California Association of Realtors (CAR) Unsold Inventory Index time series. My response would be that since the beginning of the series in 1988, average inventory has been around a six to seven month supply of homes on the market. As you can see from Figure #1, this appears to be changing. In fact, in 2015 Unsold Inventory never reached a five month supply or higher. Since the middle of 2012 inventory has not risen above five months and the average over the last four years has been three and a half months. And while there are regional differences, with the Bay Area experiencing the lowest inventory, throughout California the same downward trend is evident (Figure #2). What is going on? The answer is several things: economics, demographics, tax policy – all are playing a role. Let’s looks a little closer.
Figure 1
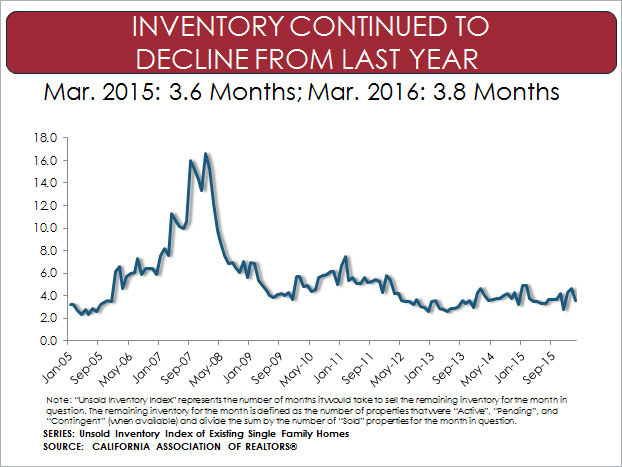
Figure 2
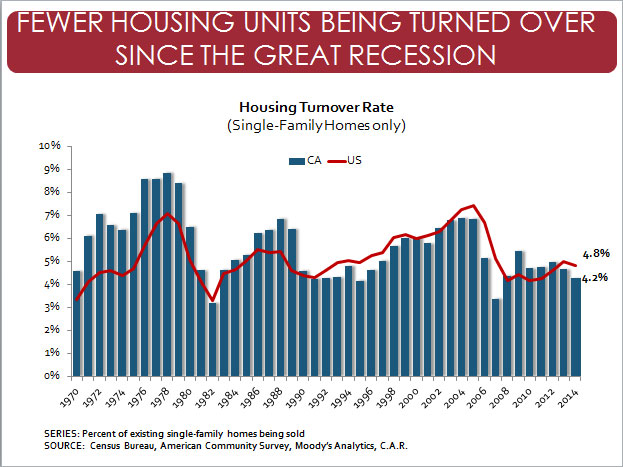
One thing that is having a significant impact on the market for existing single family homes and the level of inventory is that current homeowners are simply staying put longer. Figure #3 shows the turnover rate for the California housing stock. In the mid to late 1970’s it was in the seven to nine percent range, twice as high as we see today. In our Annual Housing Market Survey, which asks California Realtors about their last closed transaction, 10 years was the average length of time that a seller had been in their home prior to the sale. This is the highest length of time recorded since the inception of the survey in 1978.
Figure 3
How do we explain this change? As strange as it may sound, long-time homeowners are facing an affordability challenge that is preventing them from moving. When they do the math and look at what they would be giving up compared to what they would be getting, many are concluding that it makes more sense for them to stay put. Let’s look at the relevant factors:
Low rate on current mortgage – As low as rates are today they were even lower a few years ago, and many of these owners refinanced to a mortgage they would be unable to duplicate today.
Low property taxes – Because of Proposition 13, owners who have been in their homes for 20 or 30 years will be facing a significant increase in property taxes for the same or even a lower priced home if they move.
Capital gains hit – While the cap of $500,000 for a married couple is a significant amount of money, in today’s market there are homeowners, particularly in the Bay Area with gains well in excess of that amount. The reality of capital gains works against any move that they might be considering.
Scarce inventory – While this is a great time to sell, owners know that by becoming buyers they are putting themselves into a market that continues to be competitive and values are high. Why sell when there is nowhere to go, particularly if they want to stay in the same area with high valuations.
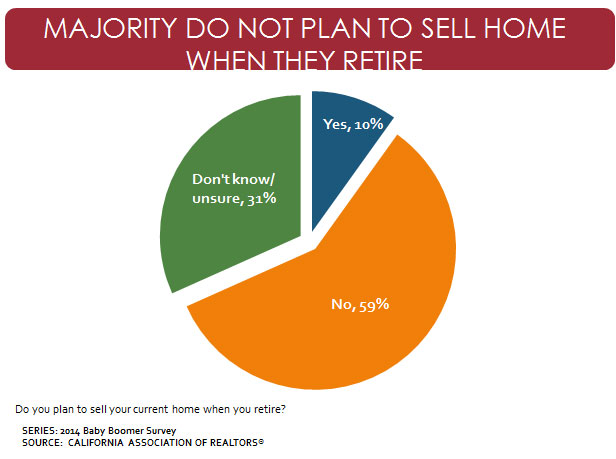
In another survey, we asked baby boomers if they planned to sell their home when they retired. The responses did not indicate an increase in the turnover rate anytime soon: 59% said “No”, 31% said they were “Unsure” and only 10% said “Yes”. (Figure #4).
Figure 4
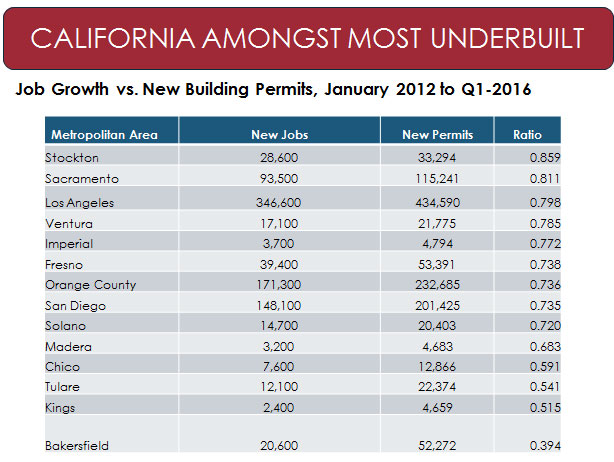
What can we expect from new construction? Figure #5 provides the recent history of new construction and with demand from new household formation of at least 165,000 new units a year, the state clearly has a lot of catching up to do. New homes add to the housing stock and provide much needed housing for the many communities that are currently undersupplied. Unfortunately, this is also a challenge for the state, home to seven of the top 11 most under-built metropolitan areas in the nation. Miami, Philadelphia, New York, Minneapolis, Denver and Boston all provide more housing than the majority of metropolitan areas in California. A San Francisco case study found that San Francisco only permitted one new unit for every 1.6 jobs compared to the U.S. average of almost two permits for every job created. It is important to note that this phenomenon is not isolated to the state’s urban cores: Merced, Yuba City, Stockton, and Sacramento are also struggling to keep pace with local growth. (Figures #6 & #7)
Figure 5
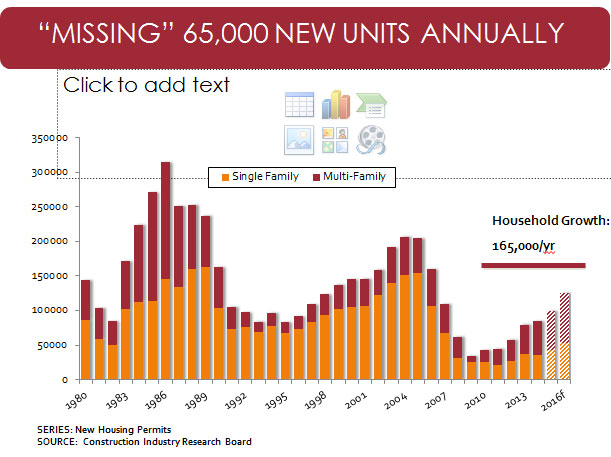
Figure 6
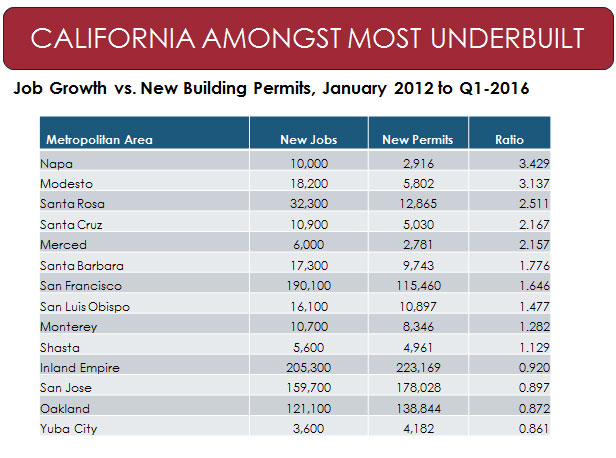
Figure 7
A recent article on the scarcity of housing in San Francisco published in the New York Times (4/17/16) had the following headline: ” In Cramped and Costly Bay Area, Cries to Build, Baby Build”. Maybe it’s time to take that cry to heart.
Leslie Appleton-Young, a member of Treasurer John Chiang’s Council of Economic Advisors, is vice president and chief economist for the California Association of Realtors. The opinions in this article are presented in the spirit of spurring discussion and reflect those of the author and not necessarily the treasurer, his office or the State of California.
